PTE口语DI题型有各种图片,考生会遇到但不限于柱图,线图,饼图,流程图,地图等图片。每个图片都有相应的框架,要想要拿好的分数,合适的答题框架和正确的框架填充方式很重要。今天羊驼小编将对为大家带来DI图表例题Precipitation and Temperature框架解析。大家可根据答题步骤了解掌握图表框架。
DI例题原图:

第一步,提取关键内容分析

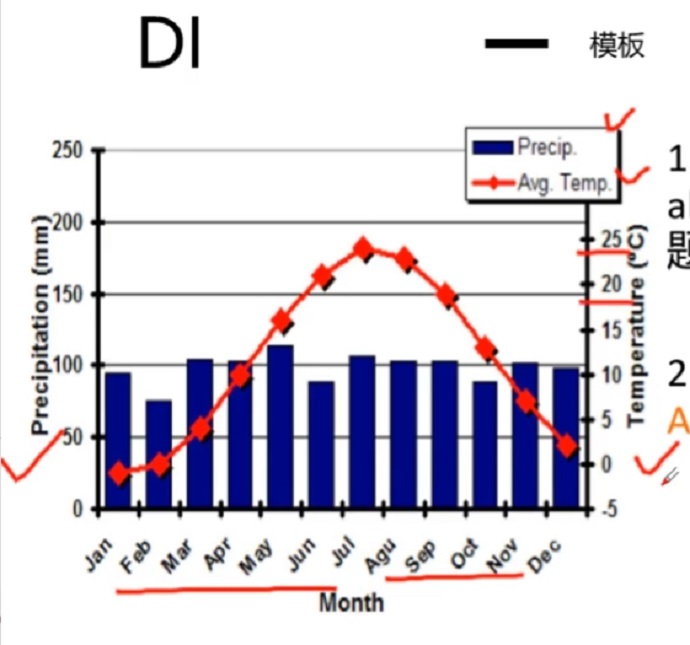
上面一张图是关于这篇PTE口语DI例题Precipitation and Temperature的关键内容分析图。
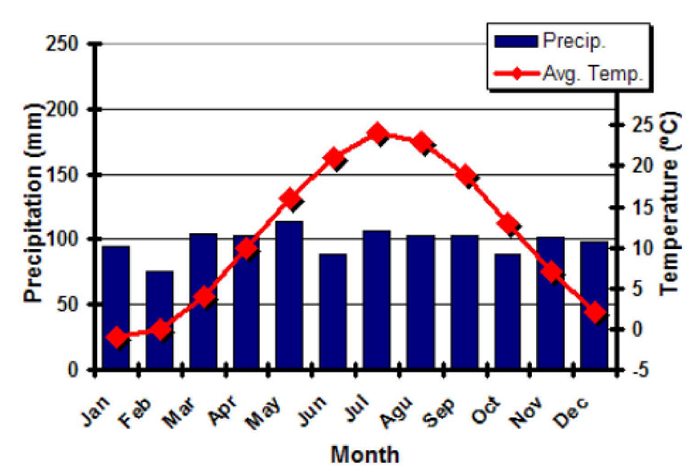
1)这一张DI例题图表需将其降雨量和温度融合在了一起,Precipitation and Temperature这两个对象都要在框架当中体现出来。
2)大家需能够熟悉图表中的单词发音。
3)图表中的月份、温度数值以及降水数值,都是关键内容,需要提取用与框架中。
第二步,框架资料使用
框架解析:
1. 标题: precipitation and temperature
2. Items:precipitation, average temperature, month
3. the largest number increases from -2.5 celcius degrees in January to 25 celcius degrees in July
4. the lowest number decreases from 25 celcius degrees to 1 celcius degrees in December and the precipation does not change so much all year round.
5. 总结句


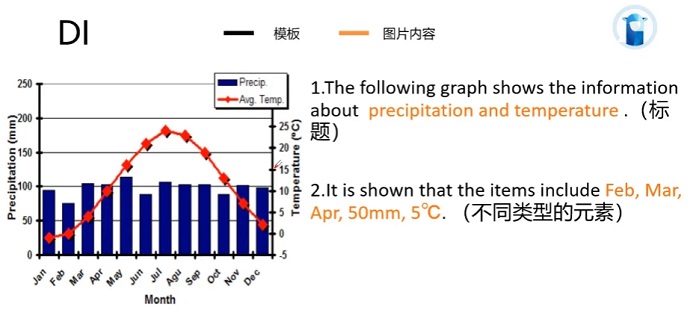
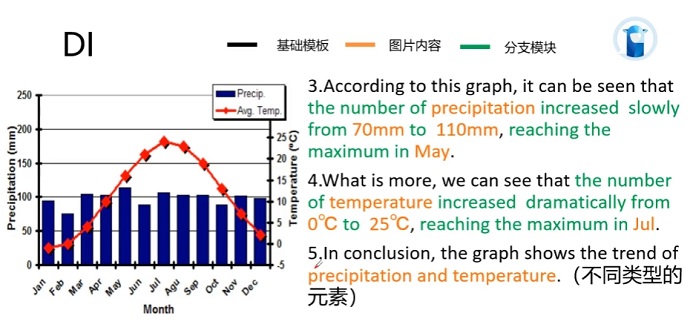
上面两张图是关于这篇PTE口语DI例题Precipitation and Temperature的框架资料的讲解示范。
1)presentation and temperature放在第一句话当中作为标题就可以了。
2)第二句话可以说一些不同类型的元素,像这边不同的月份降雨量以及温度的数值都可以说到。不限制说的对象以及数量,大家可以选择自己任意比较熟悉的数值,或者说这边的月份都是可以的。比如 items include Feb, Mar, Apr, 50mm,5℃。
3)那第三第四句采用数字的分支框架,像这边有趋势的,可以去选用趋势的这种方式。
第三句话:可以先说一下降雨量这一块,同样选择其中的某一个部分改一下它的趋势就可以。According to this graph, it can be seen that the number of precipitation increased slowly from 70mm to 110mm, reaching the maximum in May.
第四句话:可以讲一下温度,同样选择其中的自己比较熟悉的某一个短句说就可以了。What is more, we can see that the number of temperature increased dramatically from 0℃ to 25℃, reaching the maximum in Jul. 讲一下它对应的这个横轴的月份就可以。
4)最后一句话再把图片当中主要的这两个对象再进行重述。
例句示范:
1.The following graph shows the information about precipitation and temperature .(标题)
2.lt is shown that the items include Feb, Mar, Apr, 50mm,5℃.(不同类型的元素)
3.According to this graph, it can be seen that the number of precipitation increased slowly from 70mm to 110mm, reaching the maximum in May.
4.What is more, we can see that the number of temperature increased dramatically from 0℃ to 25℃, reaching the maximum in Jul.
5.In conclusion, the graph shows the trend of precipitation and temperature.(不同类型的元素)
总的来说,以上是关于PTE口语DI满分技巧解析,请注意,像这种DI例题的图片,单词发音需要很熟悉,以及它不同的单位数值,月份尽量的多说,使用数字的分支框架就可以了。


