当考生在PTE口语DI题中遇到线图题该如何作答?相较于数据类信息较多且描述逻辑简单的图片,线图题往往让考生很难抓住逻辑重点。羊驼在线老师今天通过一道例题来讲解一下描述重点。
题目:

一、确定框架提取关键词
基础模板
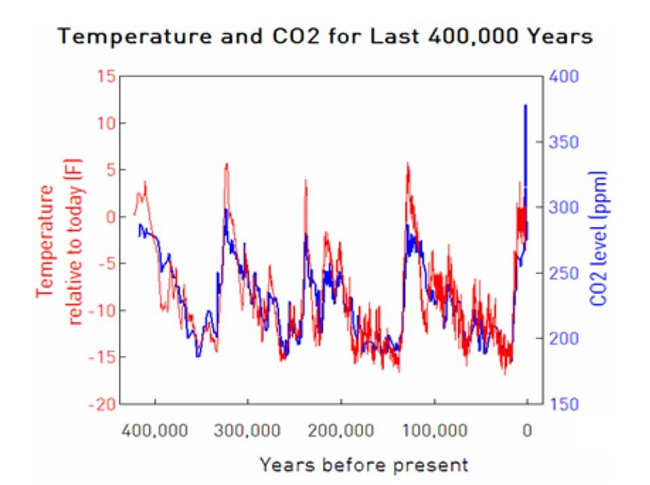
1. 标题: temperature and carbon dioxide for last four hundred thousand years;
2. Items: carbon dioxide and temperature;
3. the largest number in 100,000 years before present, 350 lppm;
4. the lowest number in 400,000 years before present, -15 Fahrenheit;
5. 总结句;
二、根据框架填充内容
黑色为框架内容,橙色是图片信息,详细填充讲解如下:

这道DI题型是一个线图题,它给出了我们标题,给出了我们横纵坐标的两个元素,分别表示这两条线的图例,也给出了横坐标。所以我们这道题就采用基础模板加线图的分支模板来说。
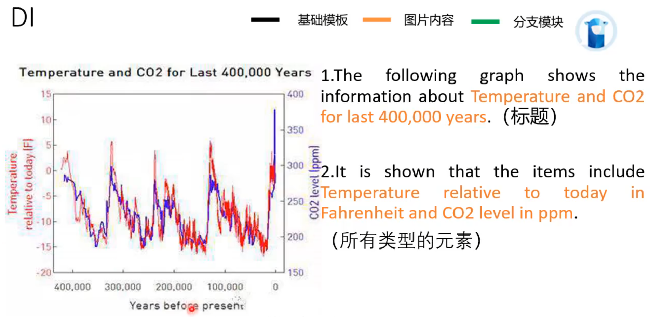
第一句话:是基础模板加title加标题,所以就是The following graph shows the information about Temperature and CO2 for last 400,000 years.
第二句话:我们就要把纵轴和以及横轴所有的元素说出来。It is show that the items include temperature relative to today in Fahrenheit and co2 level in ppm.在考试的时候,如果你没有反应出来PPM是什么,你就直接念PPM。

第三句话和第四句话呢分别我们采用基础模板加线图的分支模板来说一下条线的趋势,以及它在什么时候达到最高点。图中黑色是基础框架部分,绿色是考生可以自行调整的分支框架。
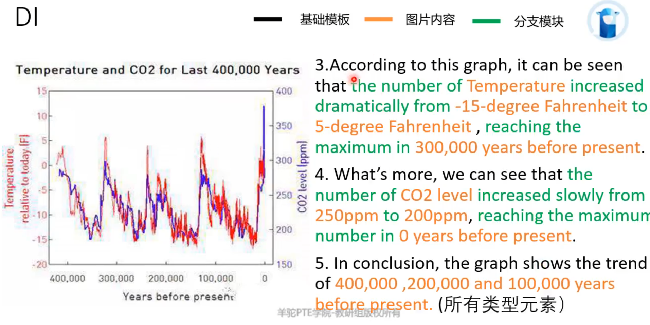
第三句话:我们就用基础模板。According to this graph, it can be seen that he number of Temperature increased dramatically from -15-degree Fahrenheit to 5-degree Fahrenheit ,reaching the maximum in 300,000 years before present.这句话我们描述红色的温度线。
第四句话:我们来描述二氧化碳蓝色的这条线。What's more, we can see that the number of CO2 level increased slowly from 250ppm to 200ppm,reaching the maximun number in 0 years before present.
第五句话:我们就可以加一些在这个图片里面还没有提到过的元素。比方说我们的纵轴我们已经说过了,然后横轴我们说了零和三十万,那我们就可以在最后一句话说四十万、二十万和十万,所以我们可以套用基础模板。In conclusion, the graph shows the trend of 400,000 ,200,000 and 100,000 years before present.


